
ECOSYSTEM SERVICES CASCADE
A comprehensive approach for measuring nature
The Ecosystem Intelligence platform is built on accepted Ecosystem Services (ES) principles and concepts, as well as the known relationships between landscape attributes, ecological functions and biogeophysical processes.
The Ecosystem Services Cascade models the production and flow of ecosystem service (ES) benefits across the landscape.
It is necessary to first understand the attributes that comprise landscape conditions. These include the biophysical attributes (site features) which, when understood in combination, contribute to the landscape’s quantifiable performance of functions.
Once this performance has been quantified, the outputs can in turn be used to further model ES production, and ultimately determine the benefit flows and value that nature provides.
-
The value of these benefits can be expressed as:Stakeholder priorities,
Monetary asset accounts,
Cost/benefit, etc.

-
Dissipation of benefits over time and distance:Serviceshed area
Extent of benefit reaching stakeholders
-
Ecosystem benefits such as:Water quality control,
Biodiversity support,
Climate regulation, etc.
-
Ecological functions/processes such as:Infiltration,
Habitat development,
Nitrogen removal, etc.
-
Characteristics of the landscape such as:Vegetative structure,
Soil composition,
Water regime, etc.
Ecosystem services and functions.
The EI models help organizations quantify the ecosystem service benefit production and the functional processes that underpin site performance.
Services
-
A measure of the landscape’s ability to provide the life history requirements for species survival (connectivity, cover/refugia, foraging, hibernation, nesting), as appropriate. Concept Diagram
-
A measure of the landscape’s ability to provide the life history requirements for species survival (connectivity, cover/refugia, foraging, hibernation, nesting), as appropriate. Concept Diagram
-
A measure of the landscape’s ability to provide the life history requirements for species survival (connectivity, cover/refugia, foraging, hibernation, nesting), as appropriate. Concept Diagram
-
A measure of the landscape’s ability to provide the life history requirements for species survival (connectivity, cover/refugia, foraging, hibernation, nesting), as appropriate. Concept Diagram
-
The capacity of the landscape to limit the redistribution and loss of soil resources by wind and water. Attributes used to estimate soil stability include dominant soil particle sizes, canopy and basal vegetative cover, slope, and soil disturbance characteristics. This model contributes significantly to the EI erosion regulation model. Concept Diagram
-
General measure of soil condition, based primarily on soil particle sizes (e.g., combinations of clay, silt, sand, etc.), the ability of organic matter to become incorporated into the soil, and the protection of soil biota. Concept Diagram
-
A measure of the landscape’s ability to provide the life history requirements for species survival (connectivity, cover/refugia, foraging, hibernation, nesting), as appropriate. Concept Diagram
-
The ability of landscape to provide resources for plant growth and reproduction. Concept Diagram
-
A estimate of a landscape’s ability to convey ordinary high water (OHW) from one location to another through channelized stream systems. Water conveyance evaluates the difference between a channelized map unit’s bankfull dimensions and its dimensions at OHW levels. The difference suggests the system’s capacity to convey water through the system during periods of elevated flow. Concept Diagram
-
The ability of landscape and design features to remove bioavailable nitrogen from flowing or infiltrated water (in the root zone of plants) through vegetative metabolic processes and/or denitrification. Concept Diagram
-
A measure of the landscape’s potential to provide stored water for use by humans. Whether water is being adequately provisioned depends, in part, on what the desired use is for the water. This measure is based on a minimum volume and depth of naturally stored water to make it easily useful for a variety of purposes (e.g., pumping for use in fire suppression). Concept Diagram
-
A measure of the landscape’s ability to maintain cool surface water temperatures. Concept Diagram
-
The ability of landscape and design features to remove particulates, including sediments and other suspended pollutants, from flowing water or runoff. Concept Diagram
-
The ability of the landscape to manage and convey a selected storm event (e.g., a 25-year storm). This metric incorporates processes such as interception, evaporation, infiltration and surface storage to predict a landscape's potential for water retention. Concept Diagram
-
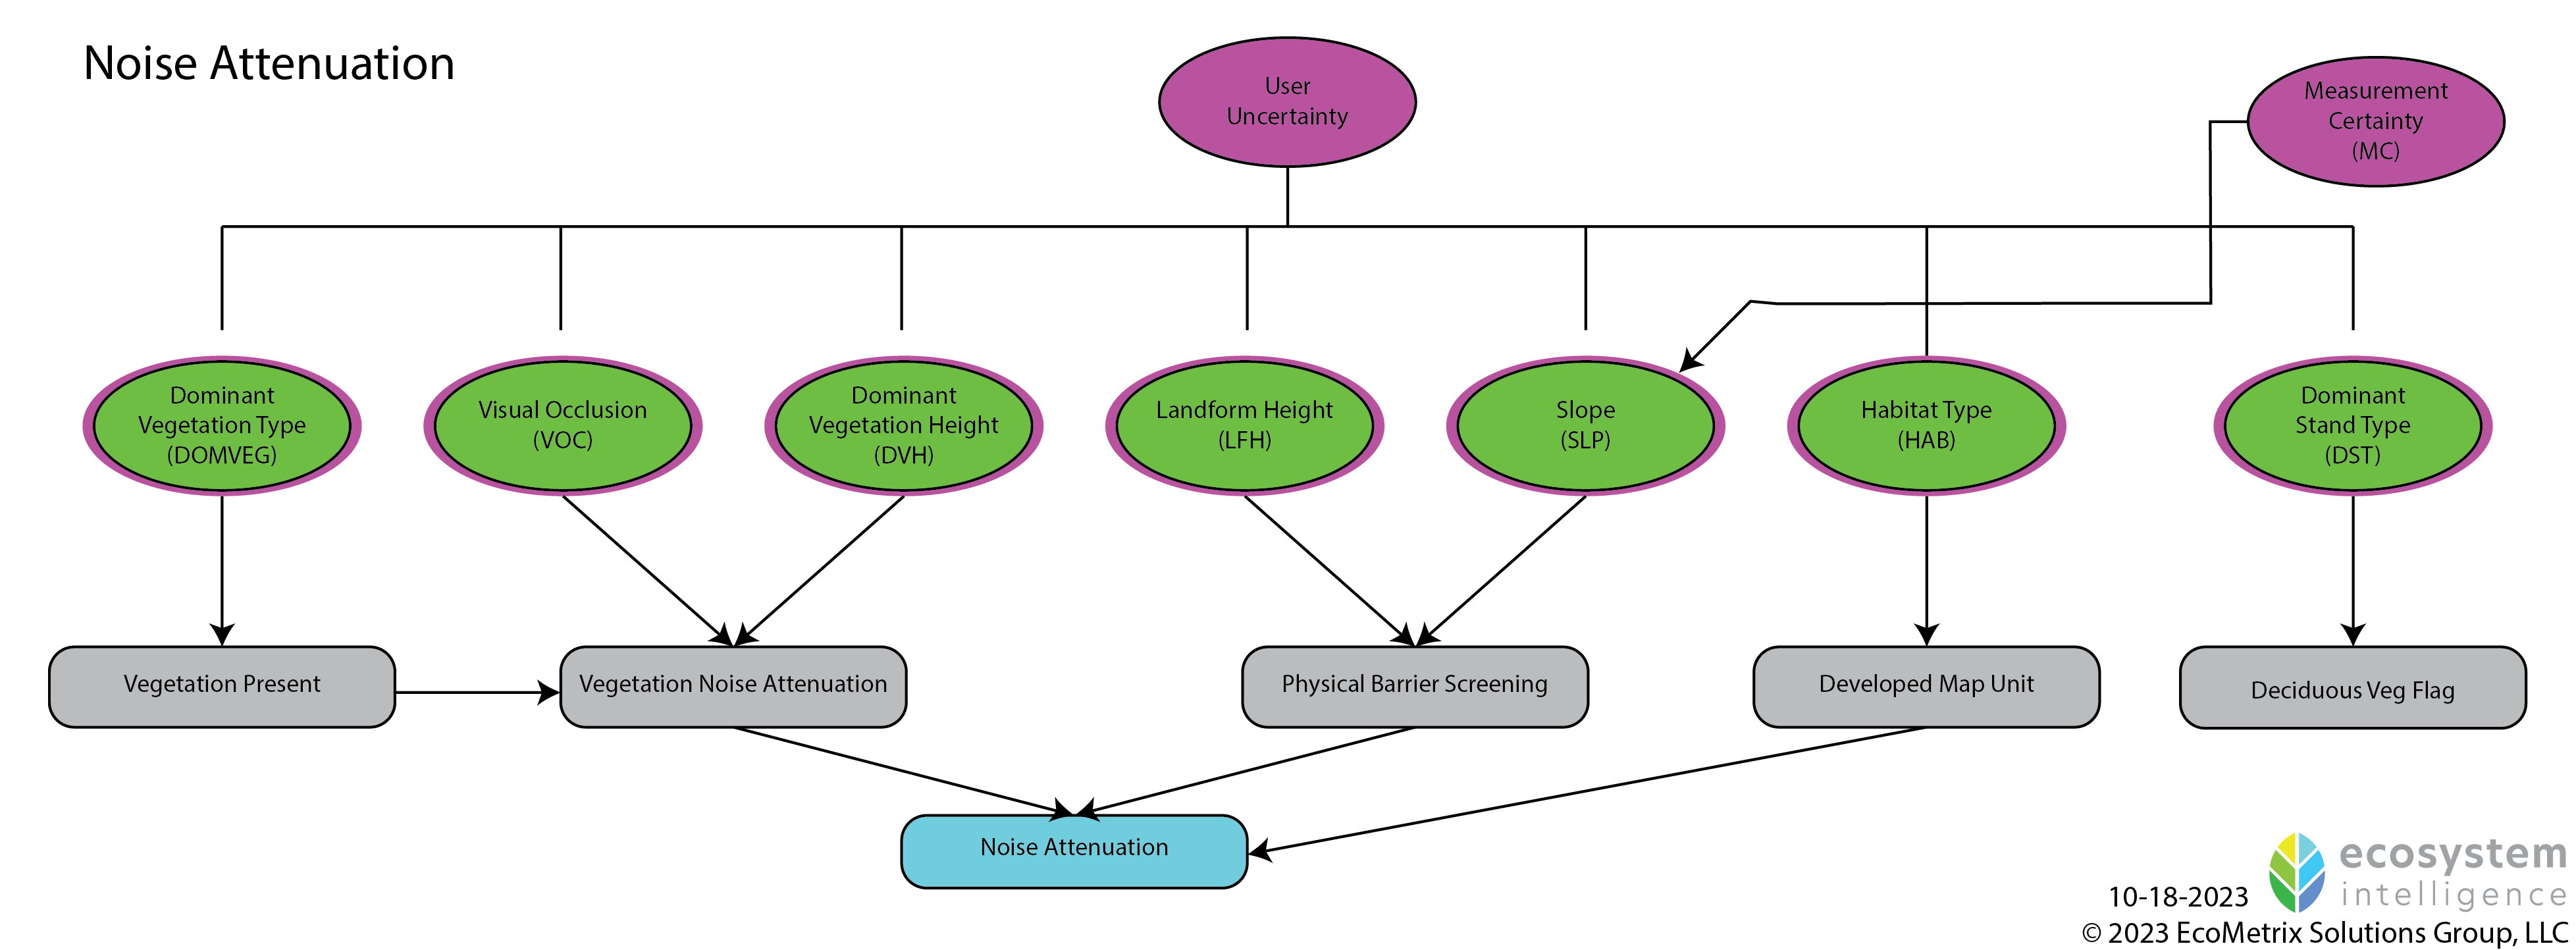
The extent to which anthropogenic noise sources can be screened or masked by the landscape and natural design features. Concept Diagram
-
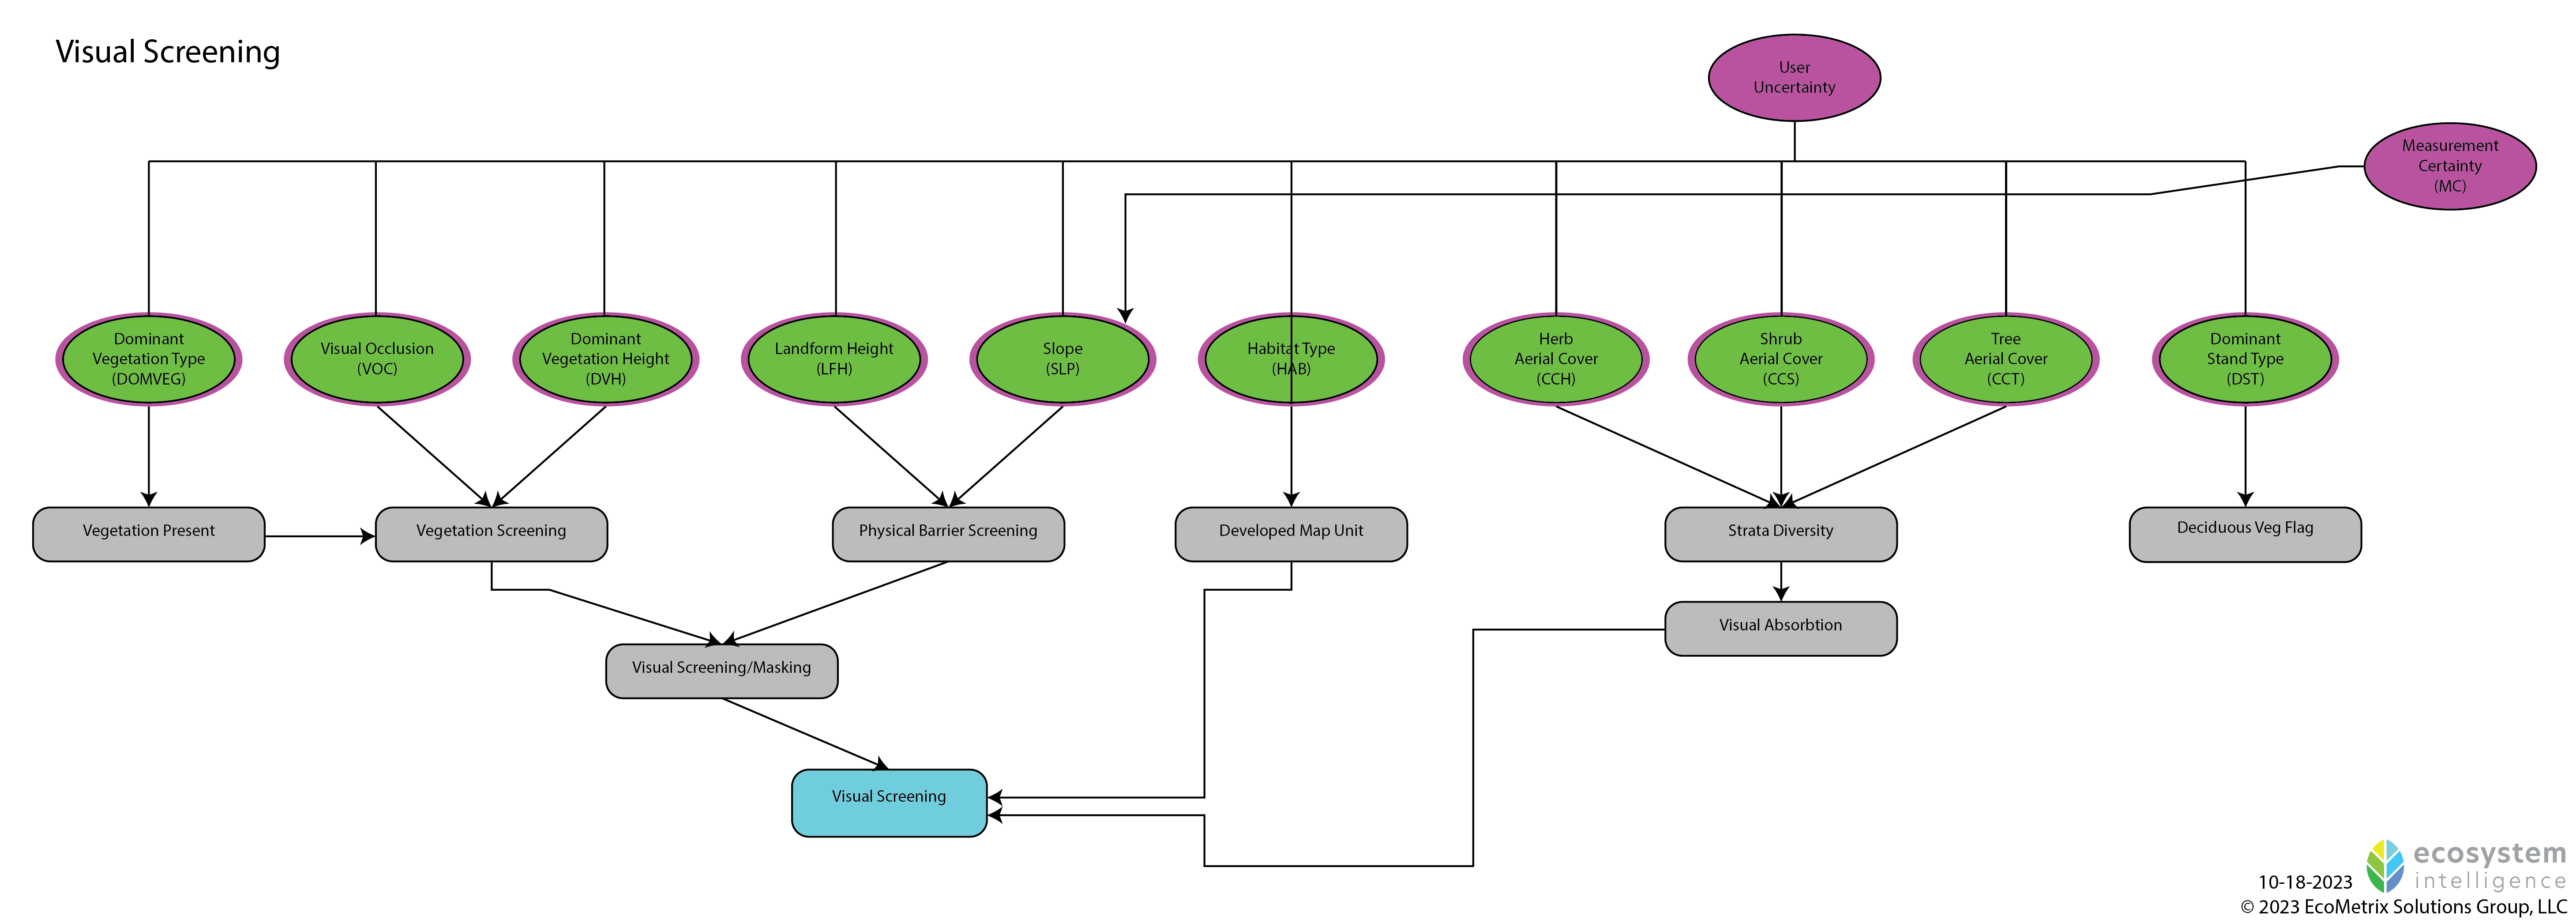
The extent to which visual disturbance from anthropogenic sources can be screened or blocked by the landscape and natural design features. Concept Diagram
-
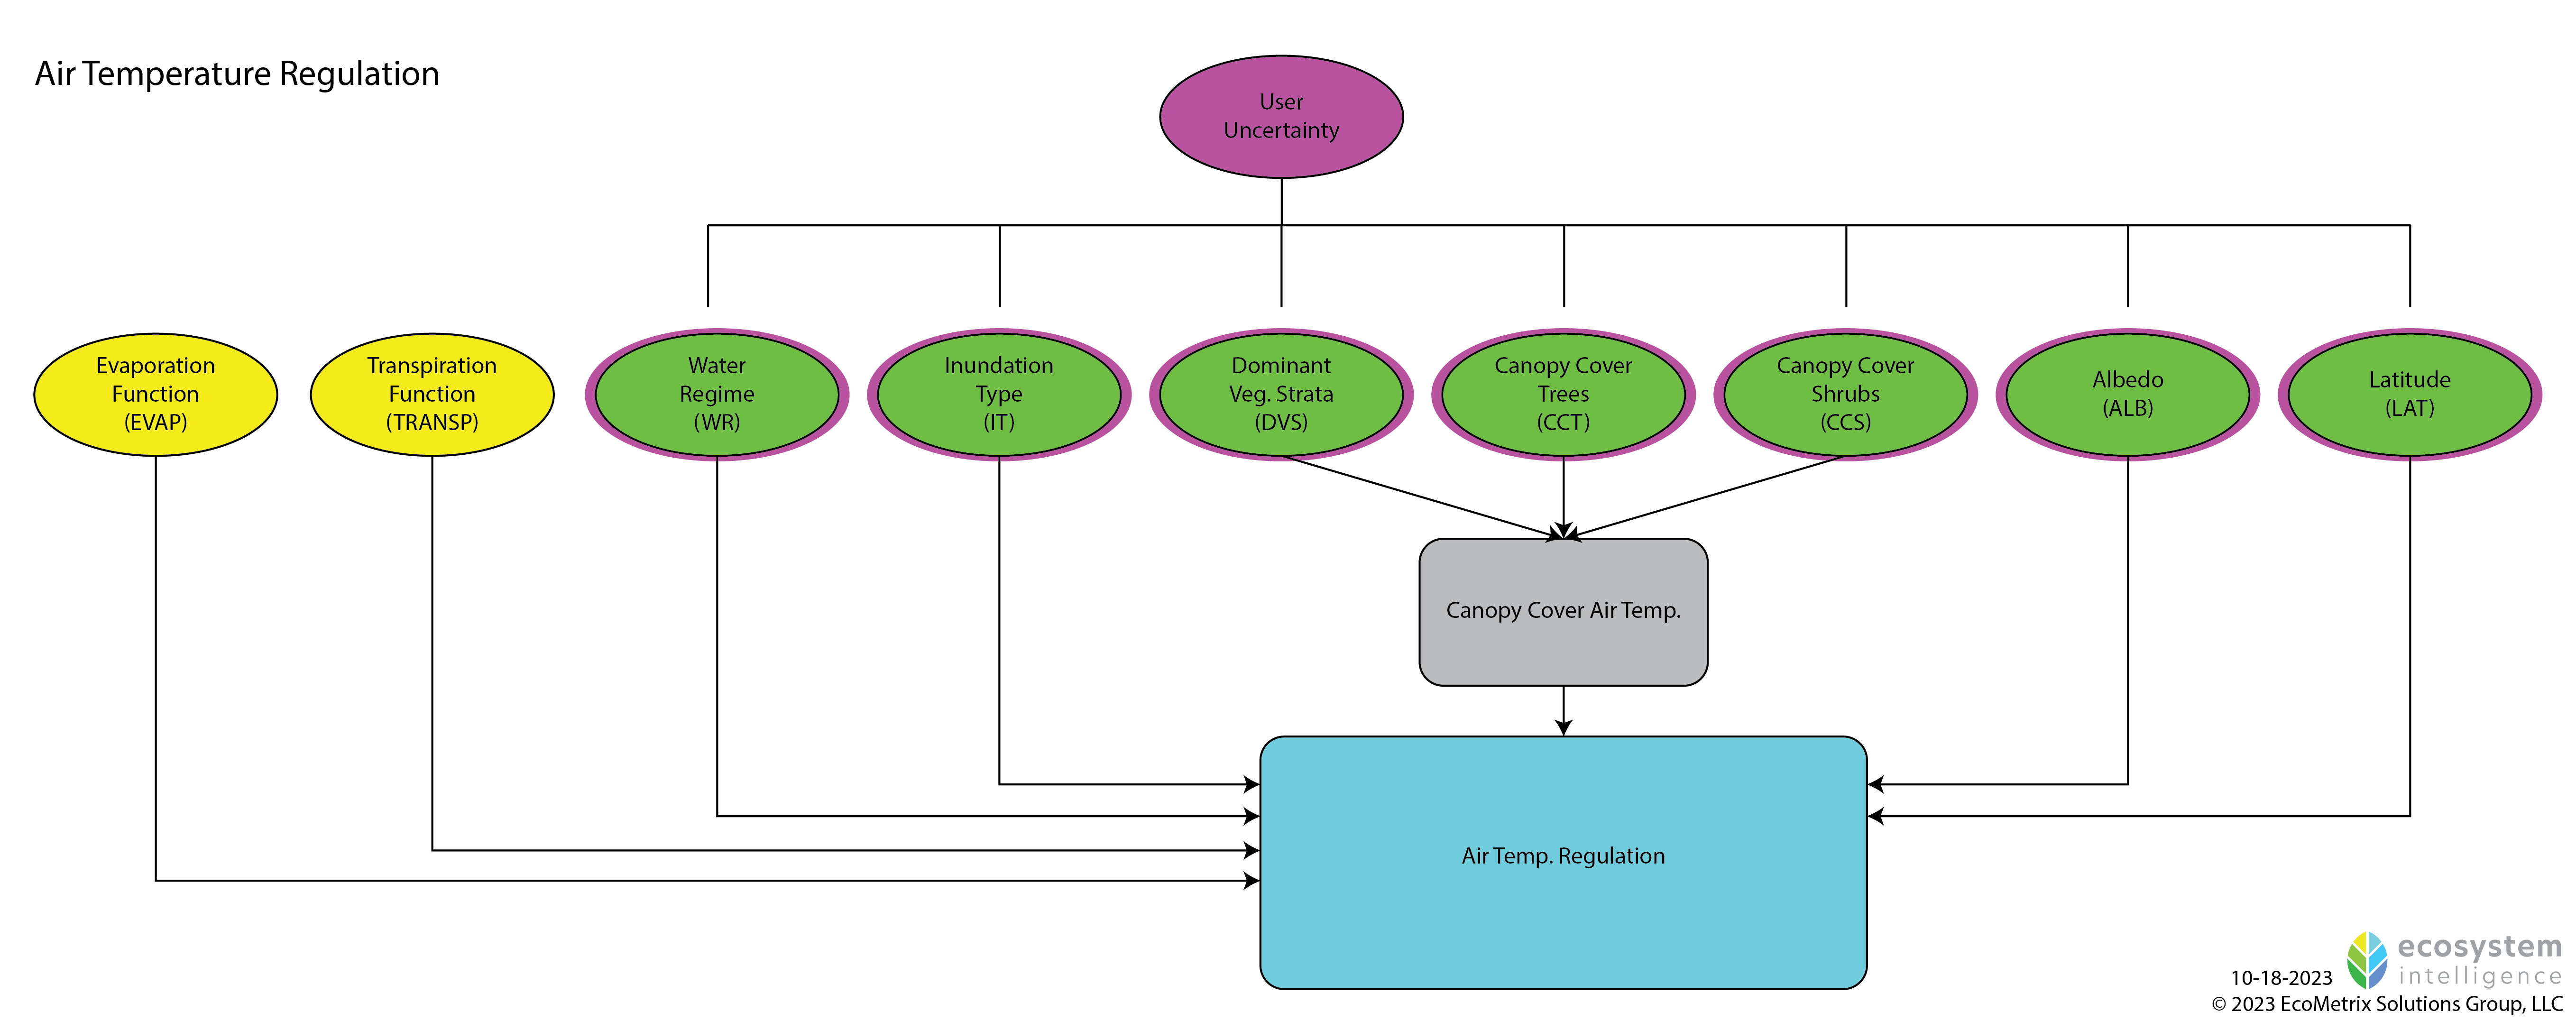
The localized thermal benefits provided by shading, evaporative cooling, surface albedo, and other natural conditions that affect temperature within an immediate area. Concept Diagram
-
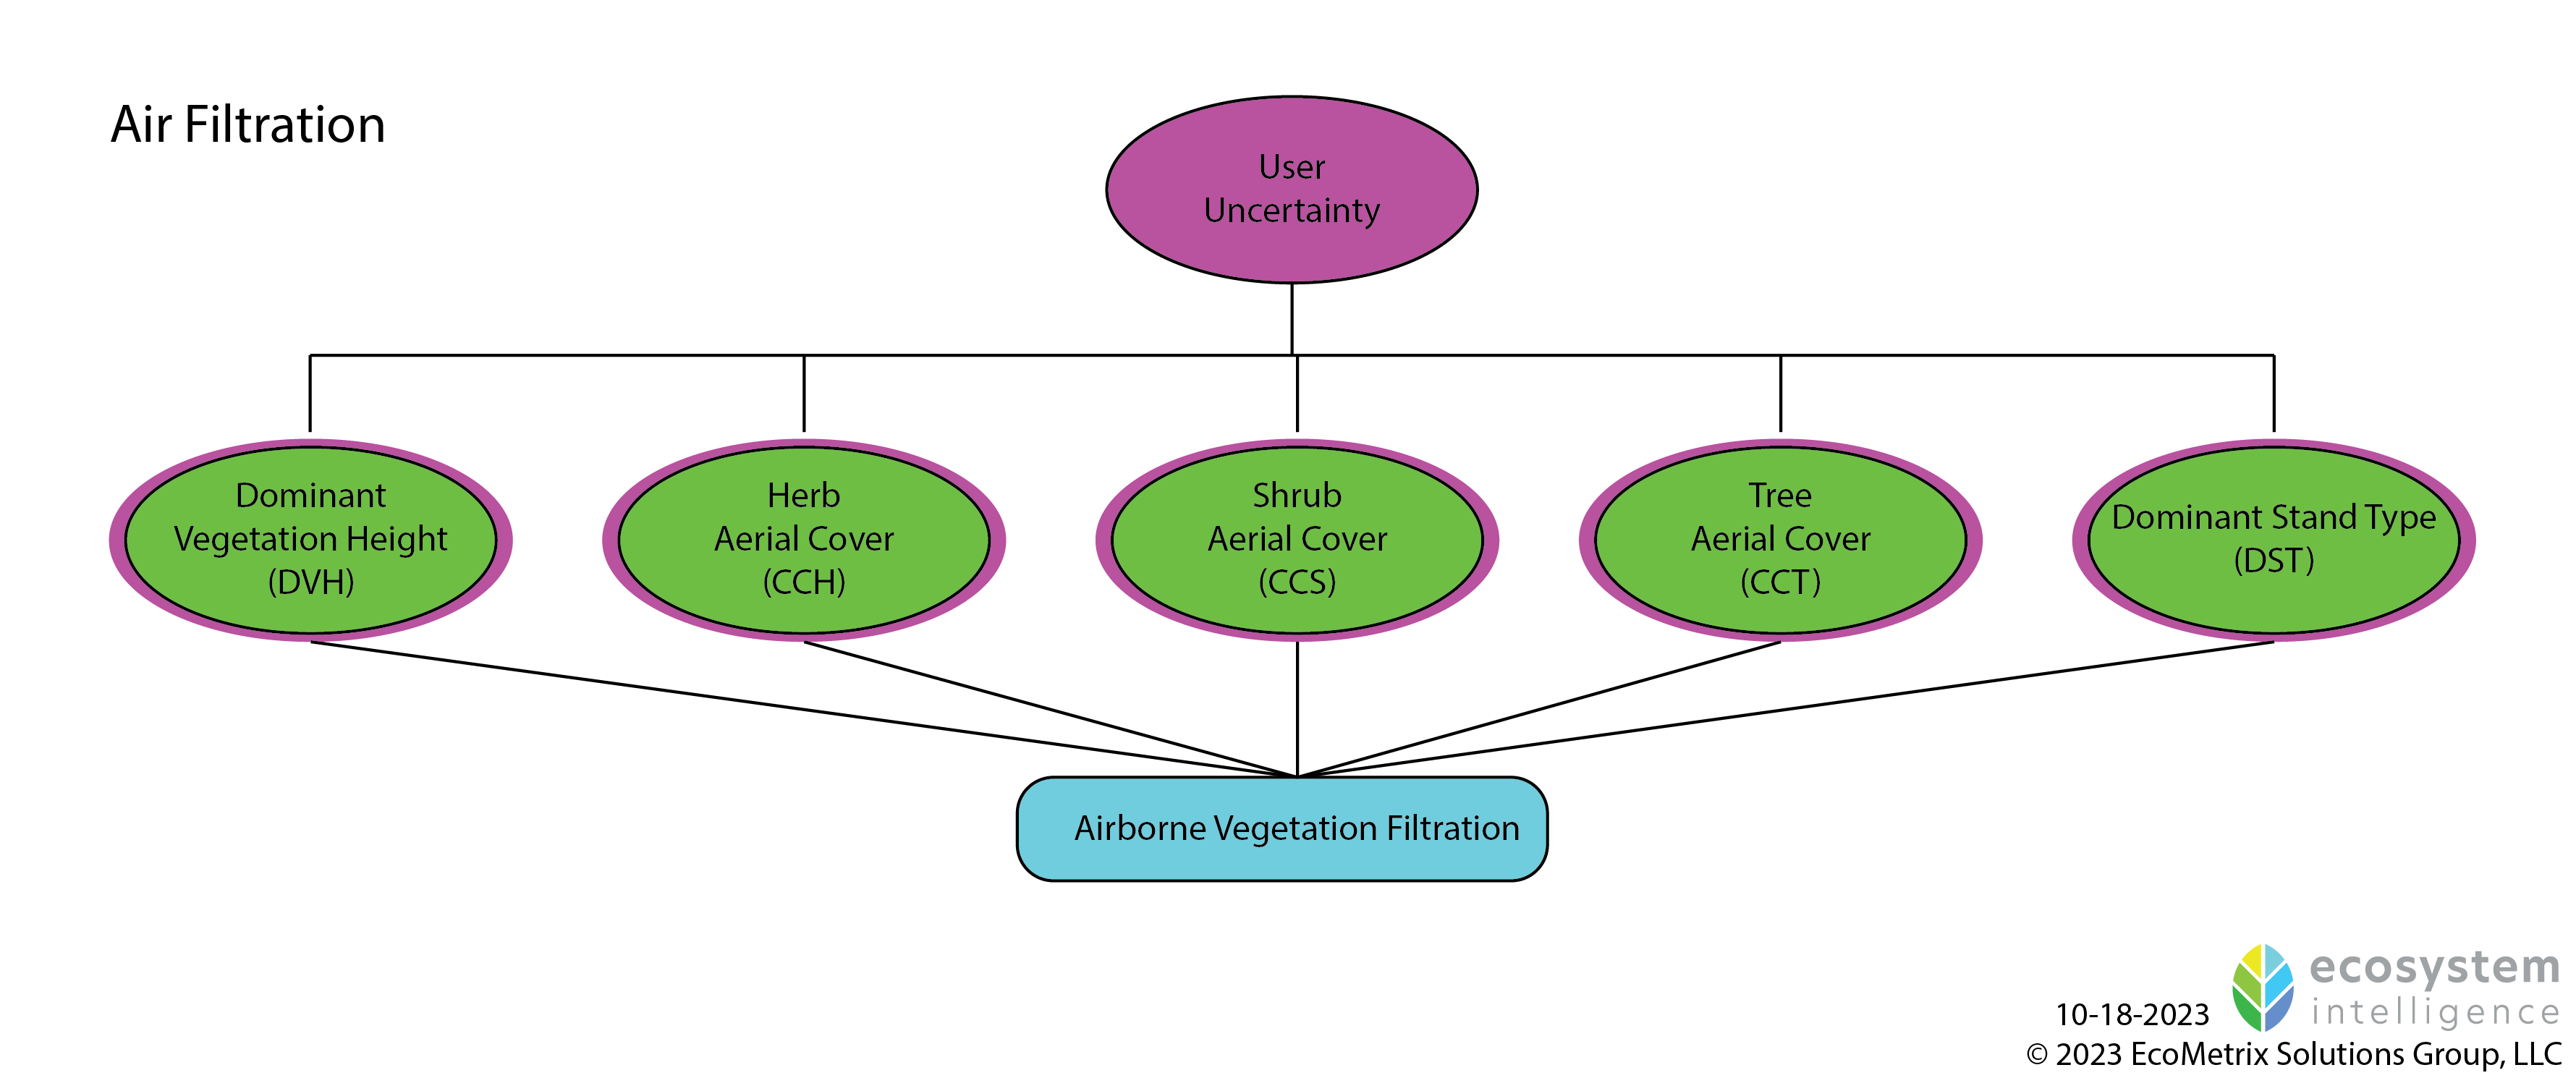
The ability of landscape and design features to filter and protect people from pollutants emitted or mobilized by wind, vehicles, or other forces. Concept Diagram
-
A measure of the landscape’s ability to provide the life history requirements for species survival (connectivity, cover/refugia, foraging, hibernation, nesting), as appropriate. Concept Diagram
-
A measure of the landscape’s ability to provide the life history requirements for species survival (connectivity, cover/refugia, foraging, hibernation, nesting), as appropriate. Concept Diagram
-
The ability of landscape and design features to support life cycle requirements for a wide range of species groups. This service is the mean performance value for insects/invertebrates, resident fish, amphibians, reptiles, songbirds, raptors, bats, small mammals, large mammals, and natural plant succession.
-
Uptake and storage of carbon by the landscape. This service includes the process of carbon removal from the atmosphere as well as storage of carbon as organic matter in soil and plant structures. Concept Diagram
-
The ability of soil to withstand the erosive forces of wind and water, which helps conserve key nutrients and protects water quality. Note that while an impervious surface may protect the soil within a selected survey area from exposure to erosive forces, it can also concentrate runoff from that survey area leading to increased erosion in downslope non-impervious areas. Concept Diagram
-
The ability of landscape and design features to support the ecological food web, based on primary production and habitat suitability for each trophic level.
-
A measure of the landscape’s ability to provide the life history requirements for species survival (connectivity, cover/refugia, foraging, hibernation, nesting), as appropriate. Concept Diagram
-
A measure of the landscape’s ability to provide the life history requirements for species survival (connectivity, cover/refugia, foraging, hibernation, nesting), as appropriate. Concept Diagram
-
Geomorphic process by which soil, sand, and rock move downslope typically as a mass, largely under the force of gravity, but frequently affected by water and soil saturation. Concept Diagram
-
Ability of natural vegetation communities to develop and advance over time. Natural plant succession involves factors that promote the predictable, gradual, and sequential change of a native terrestrial plant community towards a climax plant community particular to a specific ecoregion. Concept Diagram
-
The ability of landscape and design features to support feeding, breeding, and refugia requirements for important pollinator species. Concept Diagram
Functions
-
A measure of the ability of free‐standing water on the ground surface to move vertically downward through the soil. Concept Diagram
-
A measure of the ability to capture and accumulate precipitation falling on foliage, stems, branches, organic litter and inorganic surfaces such as rock, pavement, structures, etc. This function is viewed in terms of how these landscape conditions prevent rainfall from immediately reaching soil and either infiltrating or running off. Concept Diagram
-
A measure of the ability of a landscape to store nitrogen. Concept Diagram
-
The production of carbon compounds in aboveground biomass, detritus, and belowground biomass. Concept Diagram
-
Processes and properties that provide for the movement of organisms, and especially seeds/propagules, from one location to another for reproduction/colonization of new areas and daily/seasonal/annual migrations necessary for population viability. Concept Diagram
-
A measure of the landscape’s ability to transfer soil moisture into the atmosphere as a function of photosynthesis. Concept Diagram
-
A measure of the landscape’s potential to improve air quality through the removal of airborne nitrogen. Concept Diagram
-
The ability of the landscape to store carbon as organic matter in soil and plant structures. Concept Diagram
-
The ability of the landscape to remove carbon from the atmosphere. Concept Diagram
-
A measure of the degree to which forces acting upon a stream channel are balanced by geomorphic changes to that channel. Concept Diagram
-
A measure of the ability to remove nitrogen from the water cycle due to plant uptake, filtration of sediments, or gaseous volatilization. Concept Diagram
-
A measure of the potential to lose water to the atmosphere (from open bodies of water, exposed soil, ground cover and canopy cover). Concept Diagram
Download all Model Concept Diagrams (Biotic, Abiotic) and Definitions
Functions and services across all categories are reported on in terms of acres/hectares and percent performance.
Reporting units.
Additional metrics.
Engineering/Operational Units are also provided for those use cases where more traditional absolute metrics are needed.
Other measures coming soon.
Access to Nature A measure of a person’s ability to access natural vegetation and natural features, in both the natural and built environments.
Aesthetic Production A measure of a landscape’s ability to create sensory inputs that are generally pleasant to humans.
Atmospheric Cleansing The process by which air pollution, including ozone, nitrous oxides, sulfur oxides, and carbon dioxide are absorbed from the atmosphere by vegetation.
Desertification Avoidance A measure of site integrity in regard to minimizing the degradation of land in arid, semi-arid, and dry sub-humid areas.
Full Water Cycle A comprehensive measure of the water cycle, including evaporation, transpiration, precipitation, and runoff from the perspective of balancing the water cycle to reduce the risk of both drought and flooding.
Groundwater Recharge The maintenance of connectivity between surface water infiltration and groundwater.
Passive Recreation A measure of the landscape’s ability to provide passive recreation activities such as birdwatching and walking/hiking. This measure is heavily dependent upon site access and the presence of natural vegetation, waterways, or landforms.
Phosphorous Retention A measure of the landscape’s ability to retain dissolved phosphorus and restrict its transport into surface waters where excess inputs of phosphorus can cause eutrophication.
Sense of Place A measure of a site’s consistency with the surrounding natural and cultural environment.
Storage Capacity Ability of the landscape to store water below ground and in substrates, as opposed to surface water storage.
Additional resources on ecosystem services
Earth.org
National Ecosystem Services Partnership
Integrating Ecosystem Services into Federal Resource Management
'%3e%3cg id='Final-Copy-2_2_' transform='translate(1275.000000, 200.000000)'%3e%3cpath class='st0' d='M7.4,12.8h6.8l3.1-11.6H7.4C4.2,1.2,1.6,3.8,1.6,7S4.2,12.8,7.4,12.8z'/%3e%3c/g%3e%3c/g%3e%3c/g%3e%3cg id='final---dec.11-2020'%3e%3cg id='_x30_208-our-toggle' transform='translate(-1275.000000, -200.000000)'%3e%3cg id='Final-Copy-2' transform='translate(1275.000000, 200.000000)'%3e%3cpath class='st1' d='M22.6,0H7.4c-3.9,0-7,3.1-7,7s3.1,7,7,7h15.2c3.9,0,7-3.1,7-7S26.4,0,22.6,0z M1.6,7c0-3.2,2.6-5.8,5.8-5.8 h9.9l-3.1,11.6H7.4C4.2,12.8,1.6,10.2,1.6,7z'/%3e%3cpath id='x' class='st2' d='M24.6,4c0.2,0.2,0.2,0.6,0,0.8l0,0L22.5,7l2.2,2.2c0.2,0.2,0.2,0.6,0,0.8c-0.2,0.2-0.6,0.2-0.8,0 l0,0l-2.2-2.2L19.5,10c-0.2,0.2-0.6,0.2-0.8,0c-0.2-0.2-0.2-0.6,0-0.8l0,0L20.8,7l-2.2-2.2c-0.2-0.2-0.2-0.6,0-0.8 c0.2-0.2,0.6-0.2,0.8,0l0,0l2.2,2.2L23.8,4C24,3.8,24.4,3.8,24.6,4z'/%3e%3cpath id='y' class='st3' d='M12.7,4.1c0.2,0.2,0.3,0.6,0.1,0.8l0,0L8.6,9.8C8.5,9.9,8.4,10,8.3,10c-0.2,0.1-0.5,0.1-0.7-0.1l0,0 L5.4,7.7c-0.2-0.2-0.2-0.6,0-0.8c0.2-0.2,0.6-0.2,0.8,0l0,0L8,8.6l3.8-4.5C12,3.9,12.4,3.9,12.7,4.1z'/%3e%3c/g%3e%3c/g%3e%3c/g%3e%3c/g%3e%3c/svg%3e) Your Privacy Choices
Notice at Collection
Your Privacy Choices
Notice at Collection